Co-op Tile World
Human-in-the-loop Game Environment for Cooperative AI Performance Benchmark
Project Overview
Co-op Tworld bechmarking environment Github respository.
The need of human-in-the loop bechmarking system in development of Cooperative AI
This research introduces a custom benchmarking environment called Co-op Tile World, specifically designed to support experimentation on socially cooperative AI and human cooperation. Furthermore, this study leverages the environment to evaluate cooperative performance between human players and AI agents, parameterizing the agent’s social feature—its alignment with the human’s decisions in the collective decision-making process—across two levels of task difficulty.
Research Question
- RQ1 (Design): How should we design a benchmarking game environment for cooperation between humans and socially intelligent agents?
- RQ2 (Assessment): How can we assess cooperative performance between humans and socially intelligent agents using this custom environment?
Design: Co-op Tile World
Design Process of Co-op Tile World
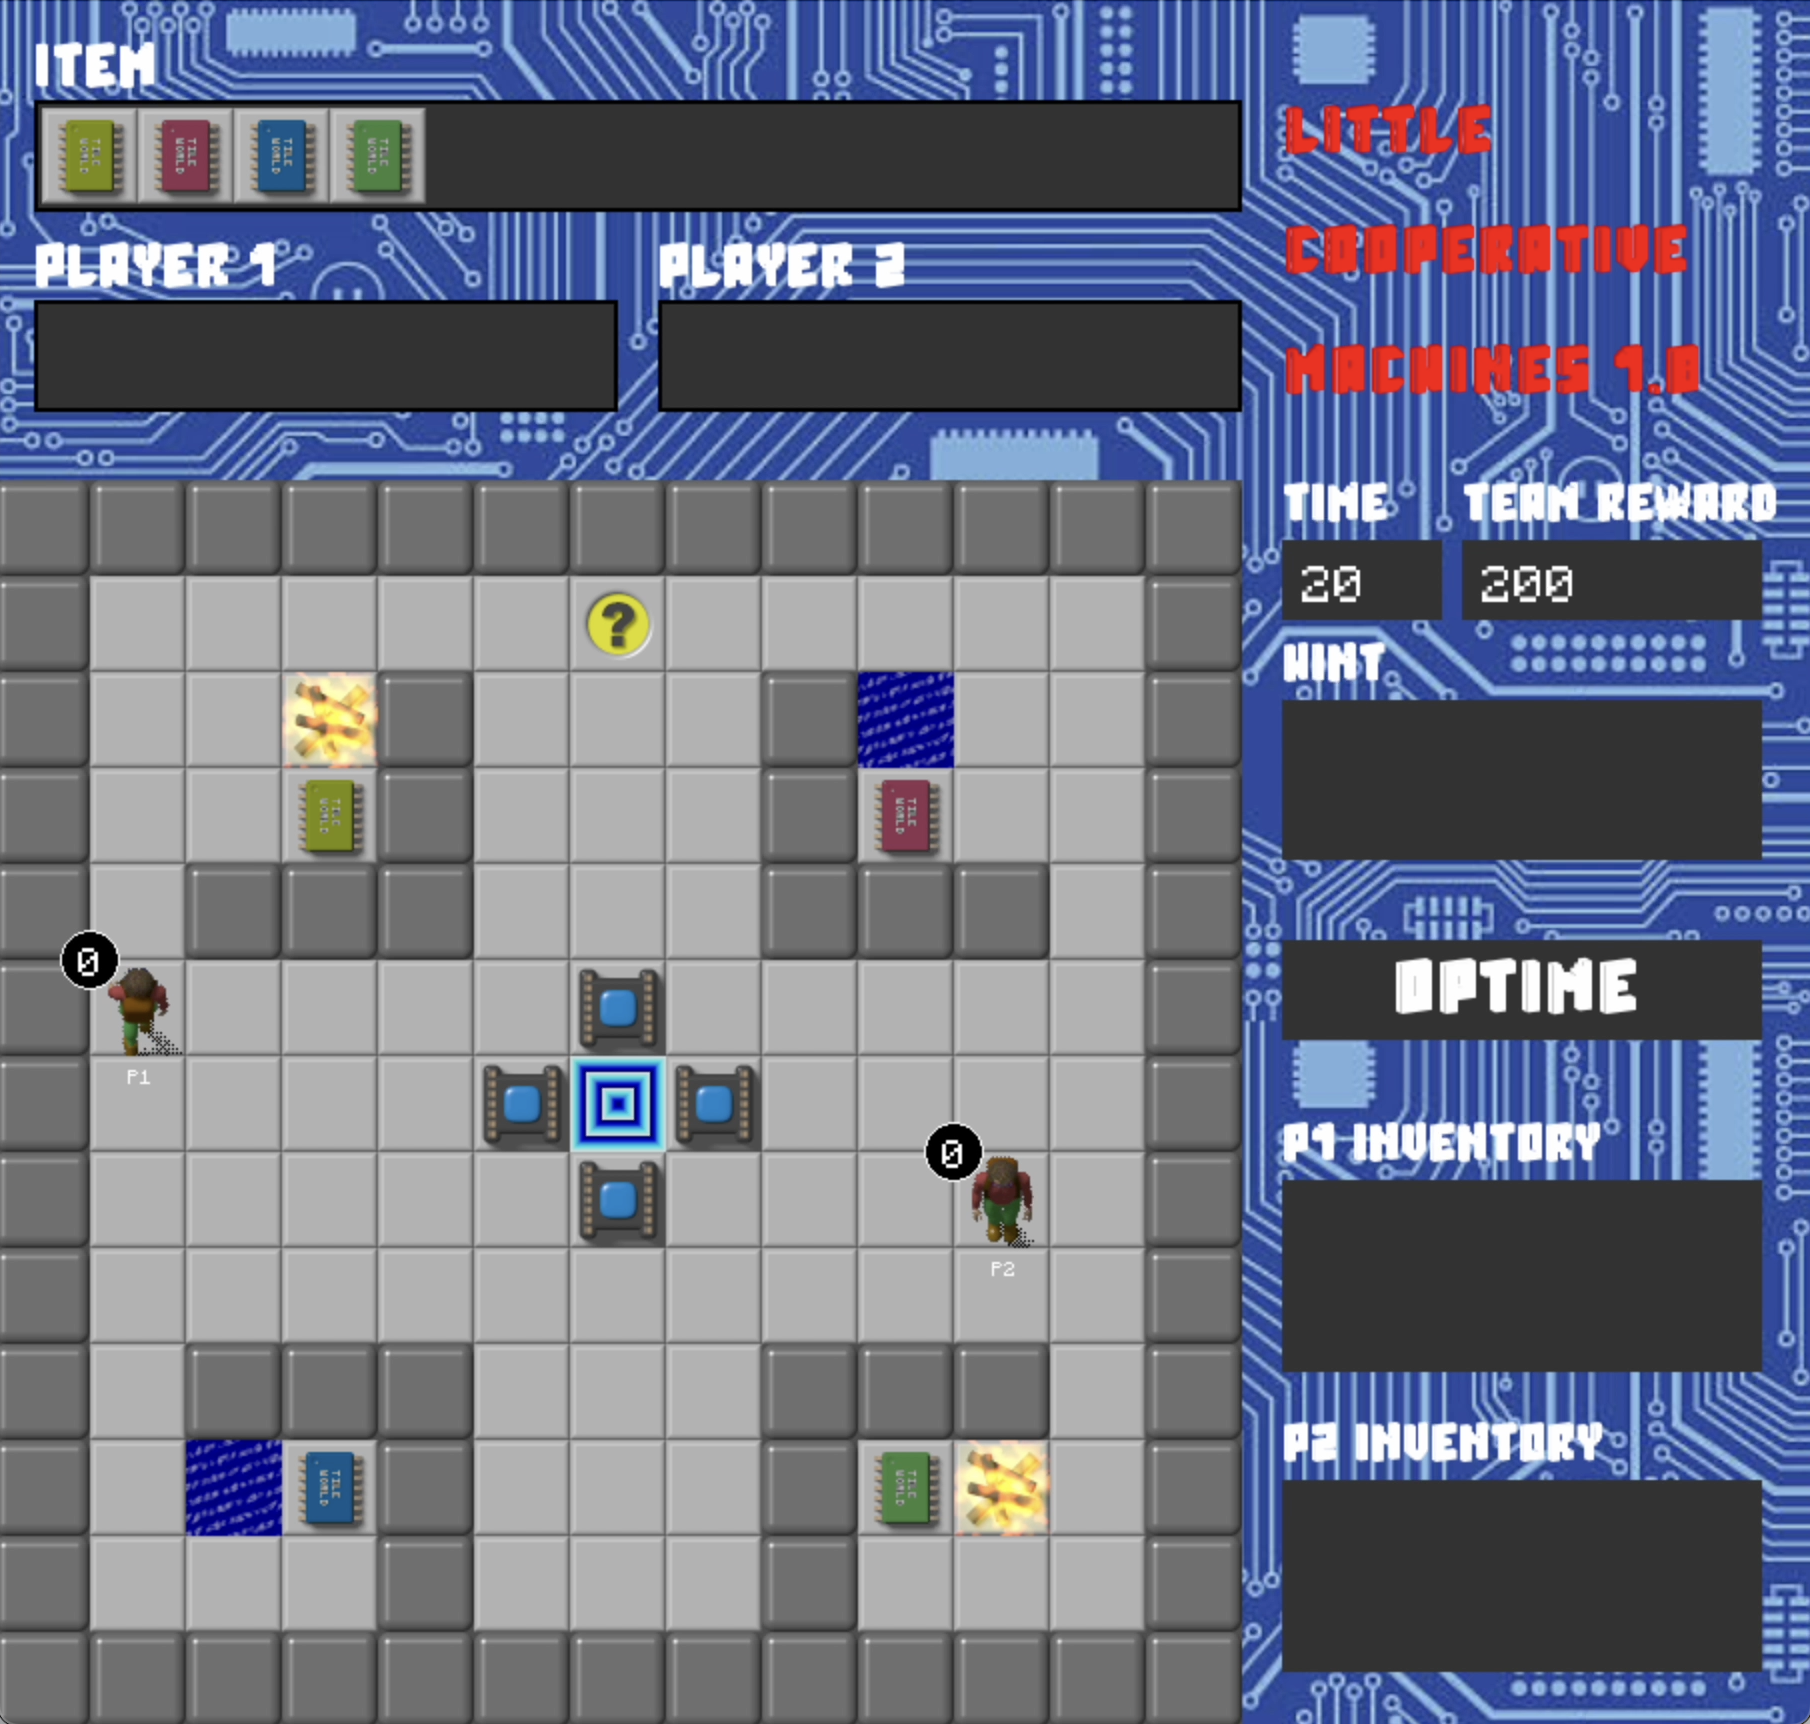
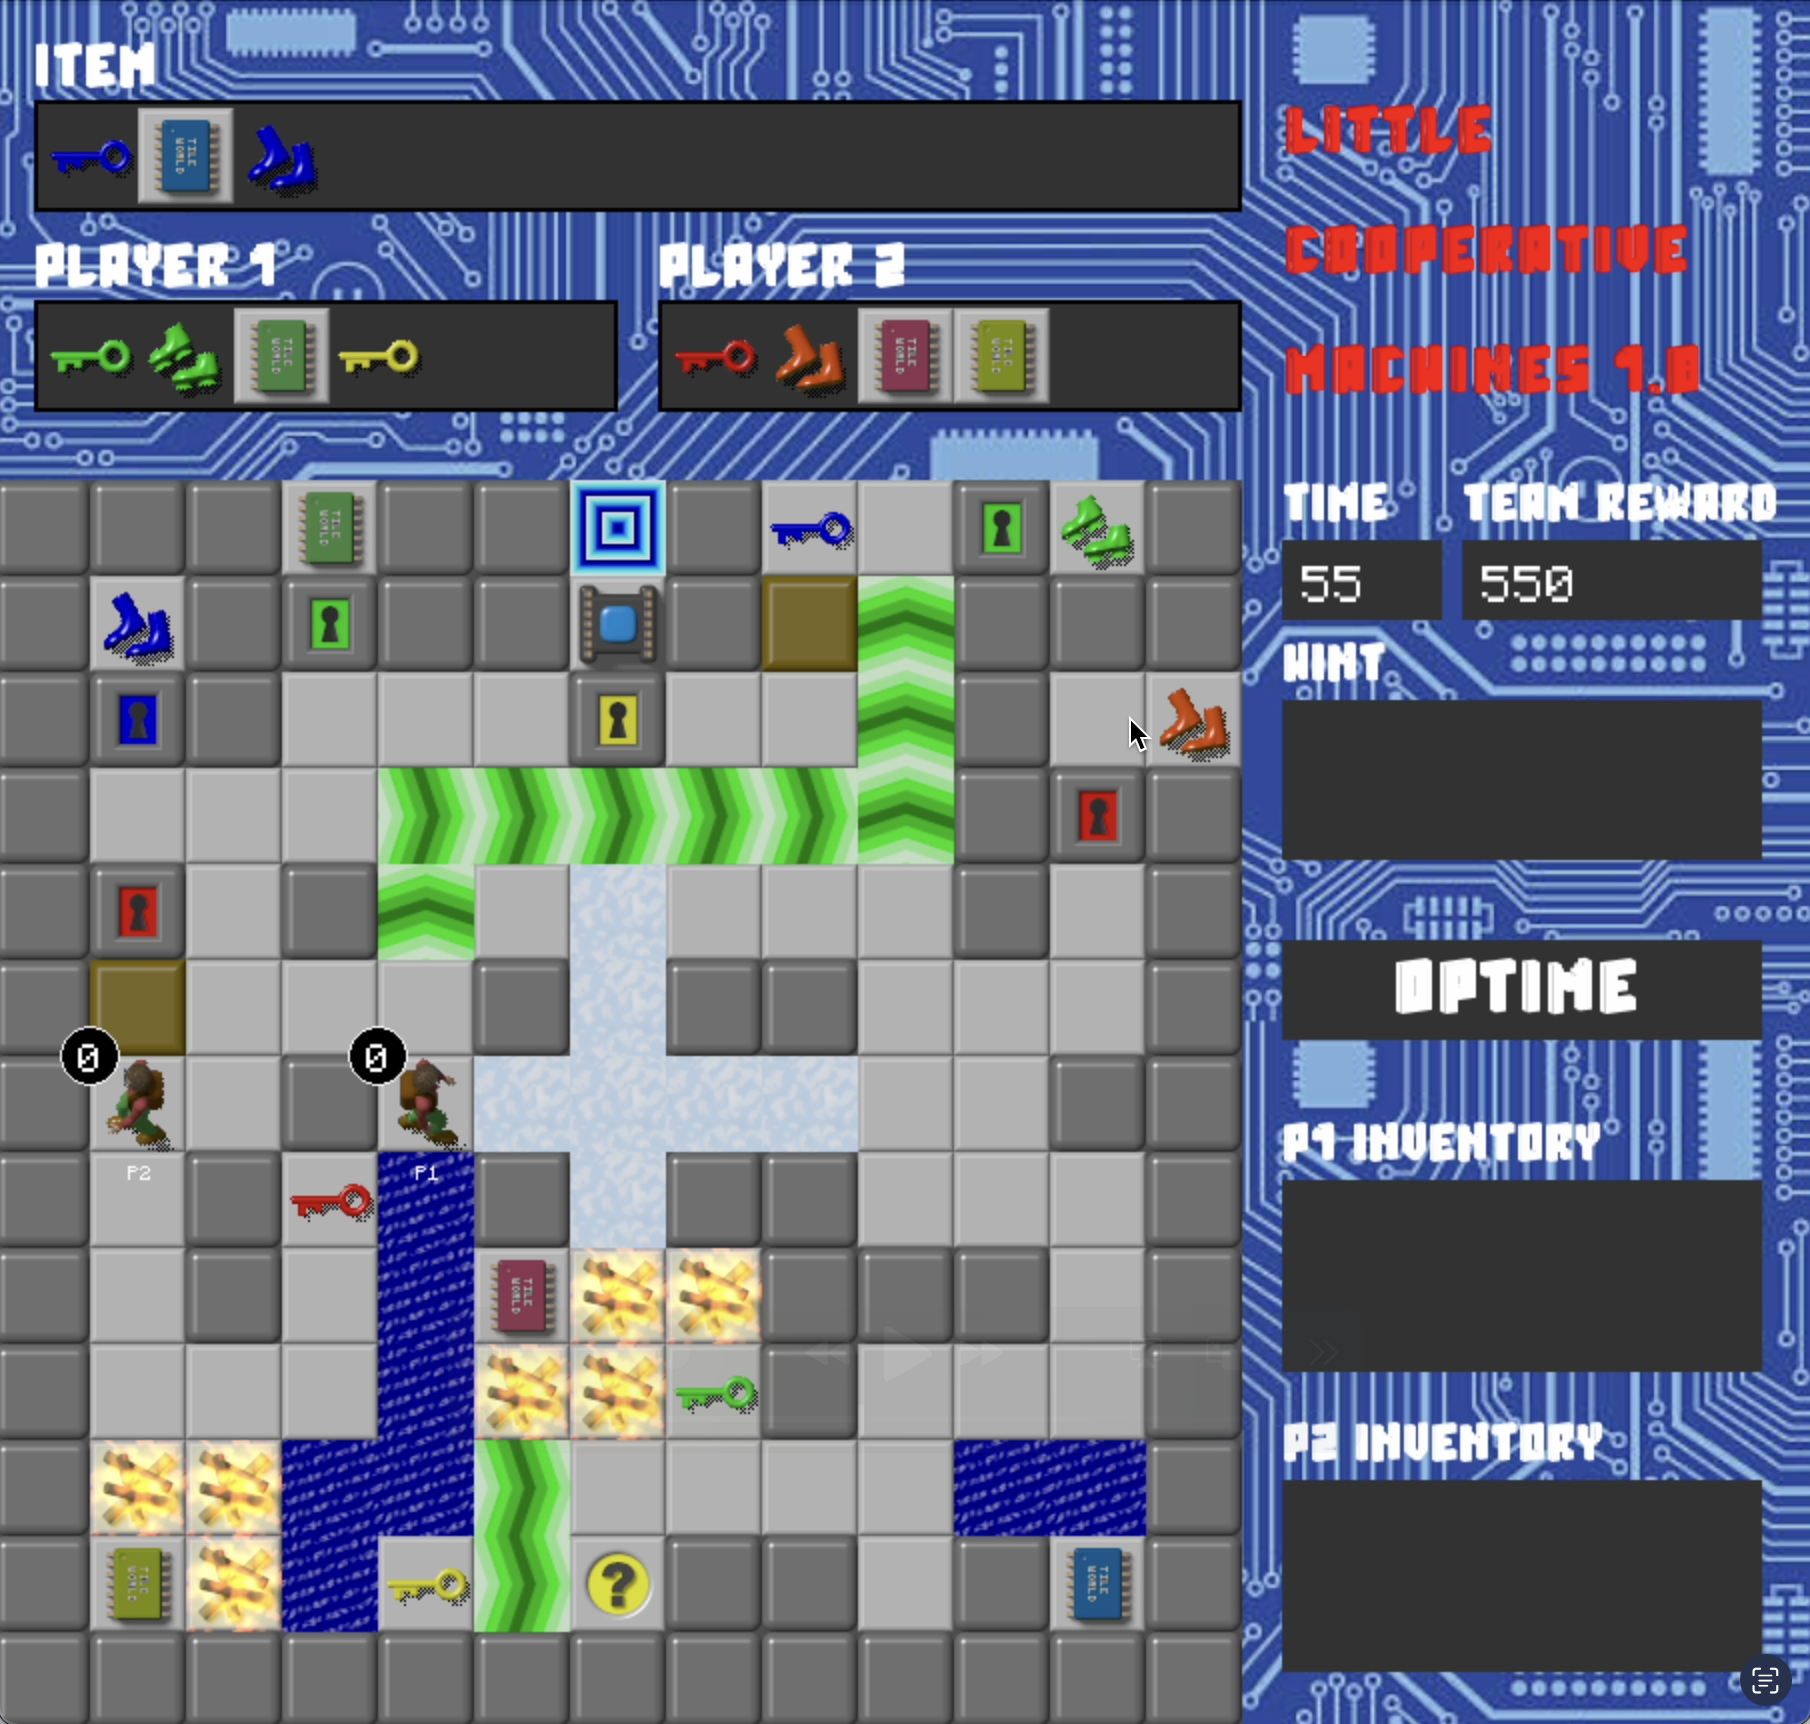
Added Game System for Cooperative Play
- Fundamental Rules
- Each player maintains their own item inventory.
- Only the player who possesses an item in their inventory can interact with the corresponding tile.
- Sophisticated time rule has been implemented to support richer cooperative scenarios and enhance gameplay dynamics.
- Advanced Rules
- The team reward is calculated based on the time remaining when the level is completed.
- Individual rewards are determined by the number of collectible items each player obtains during gameplay.

Supported Game Mechanics
The current version of Co-op Tile World supports game mechanics of collecting 9 collectible items, unlocking 5 tiles, interacting with 7 interactable tiles, collision detection with 1 monster type (beetle), and reaching the exit tile.
Google Sheet Level Editor
Using this tool, designers can easily create custom levels using Google Sheets. Once all tiles are placed on the spreadsheet, a custom Google Apps Script is used to convert the level data into a JSON file format. This approach offers an efficient workflow for prototyping, testing, and validating different level designs before finalizing them for experimental use.
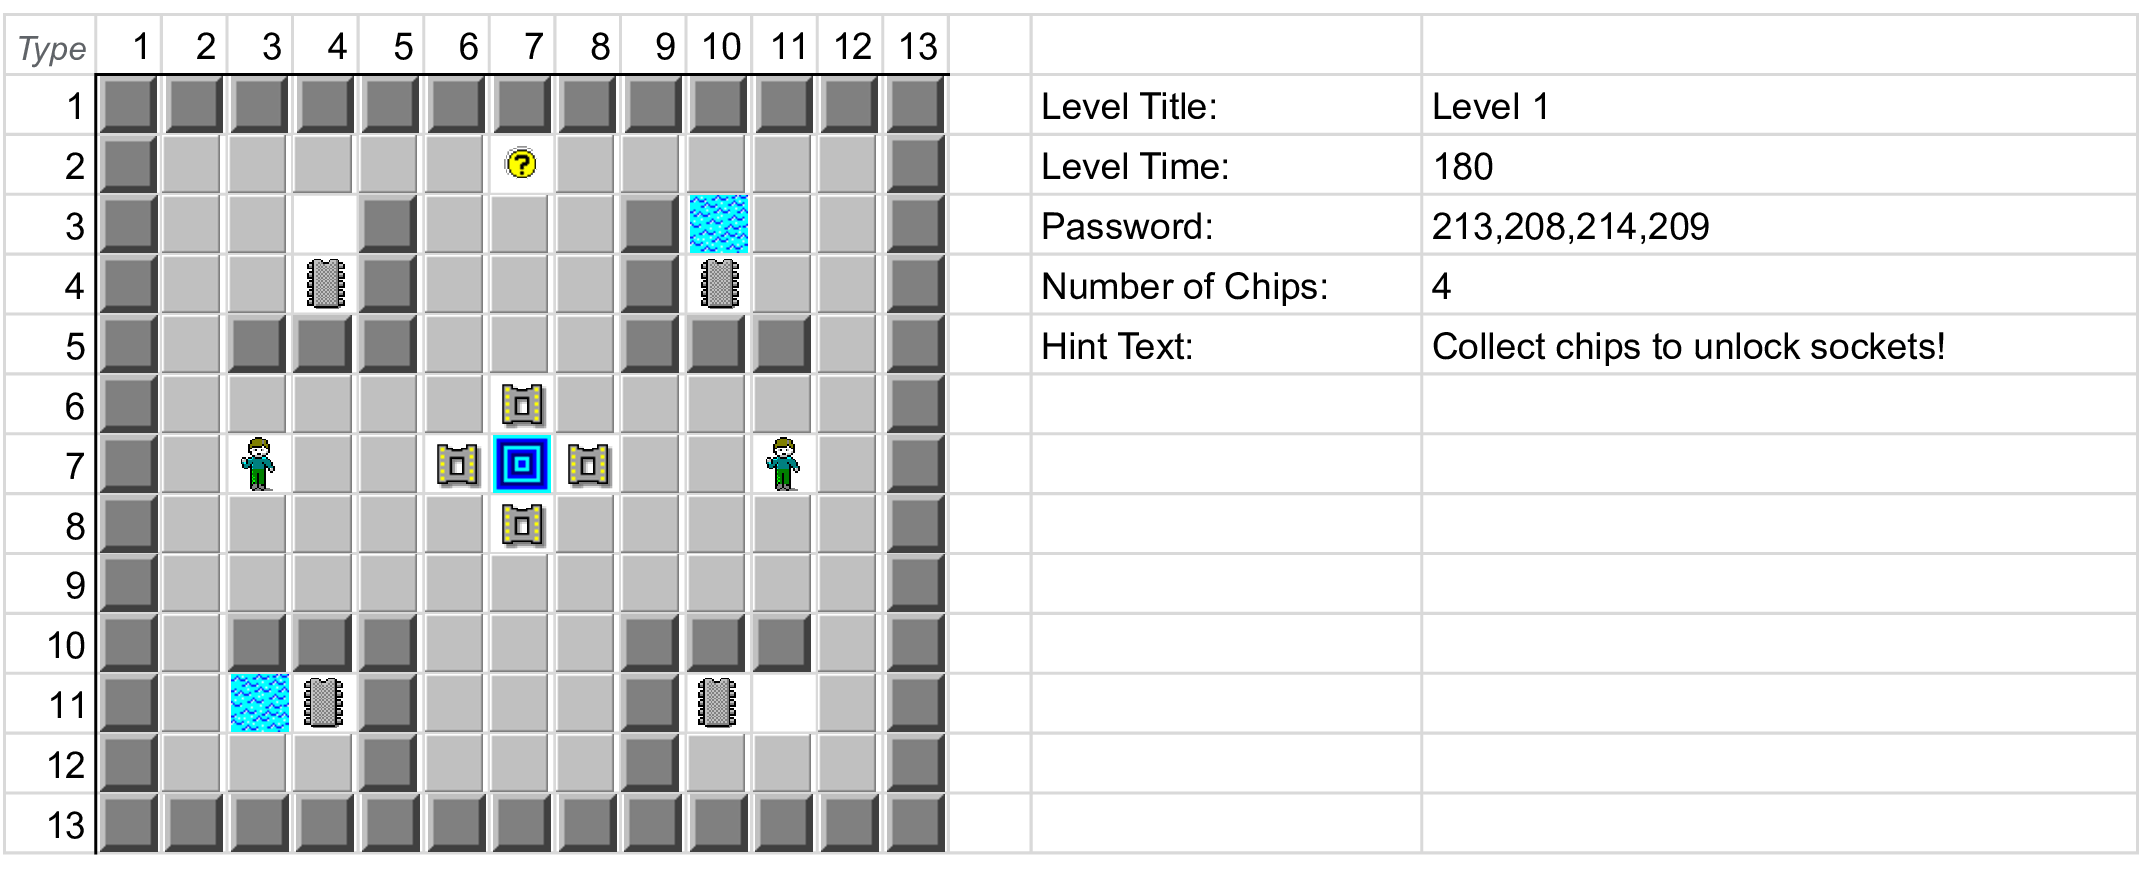
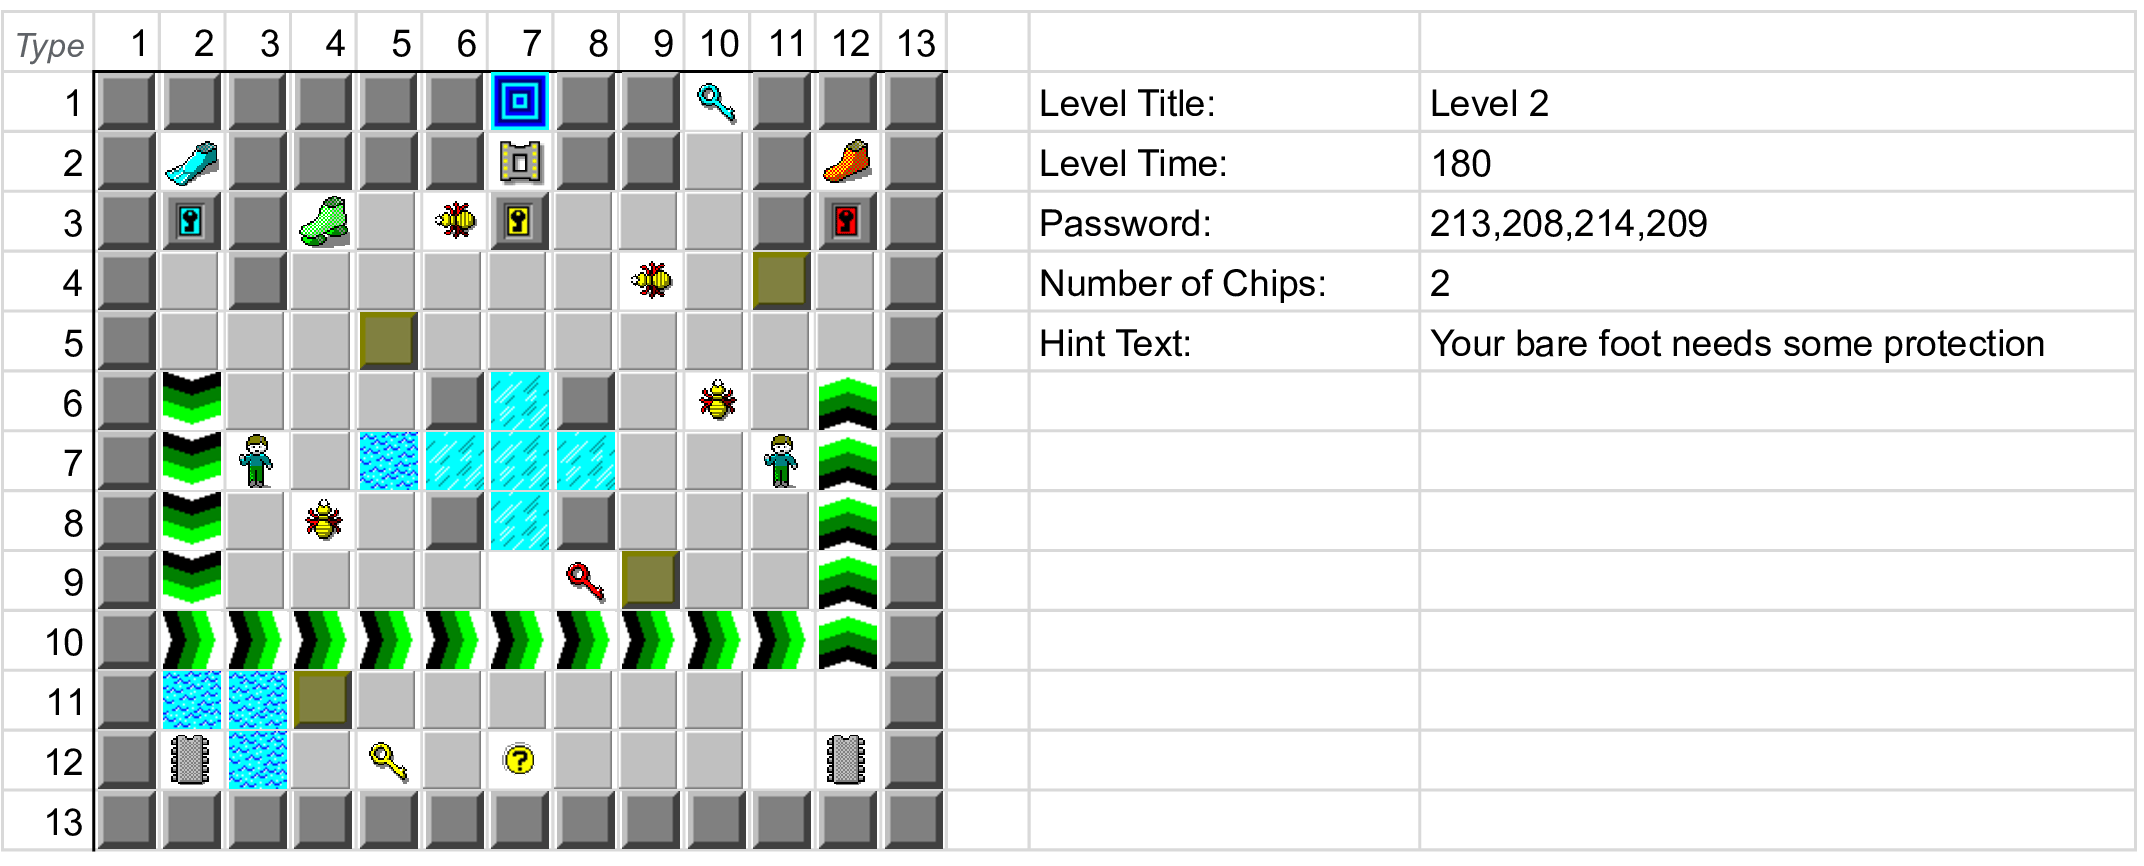
Final Two Levels
Design: Agent Development
High Level Architecture
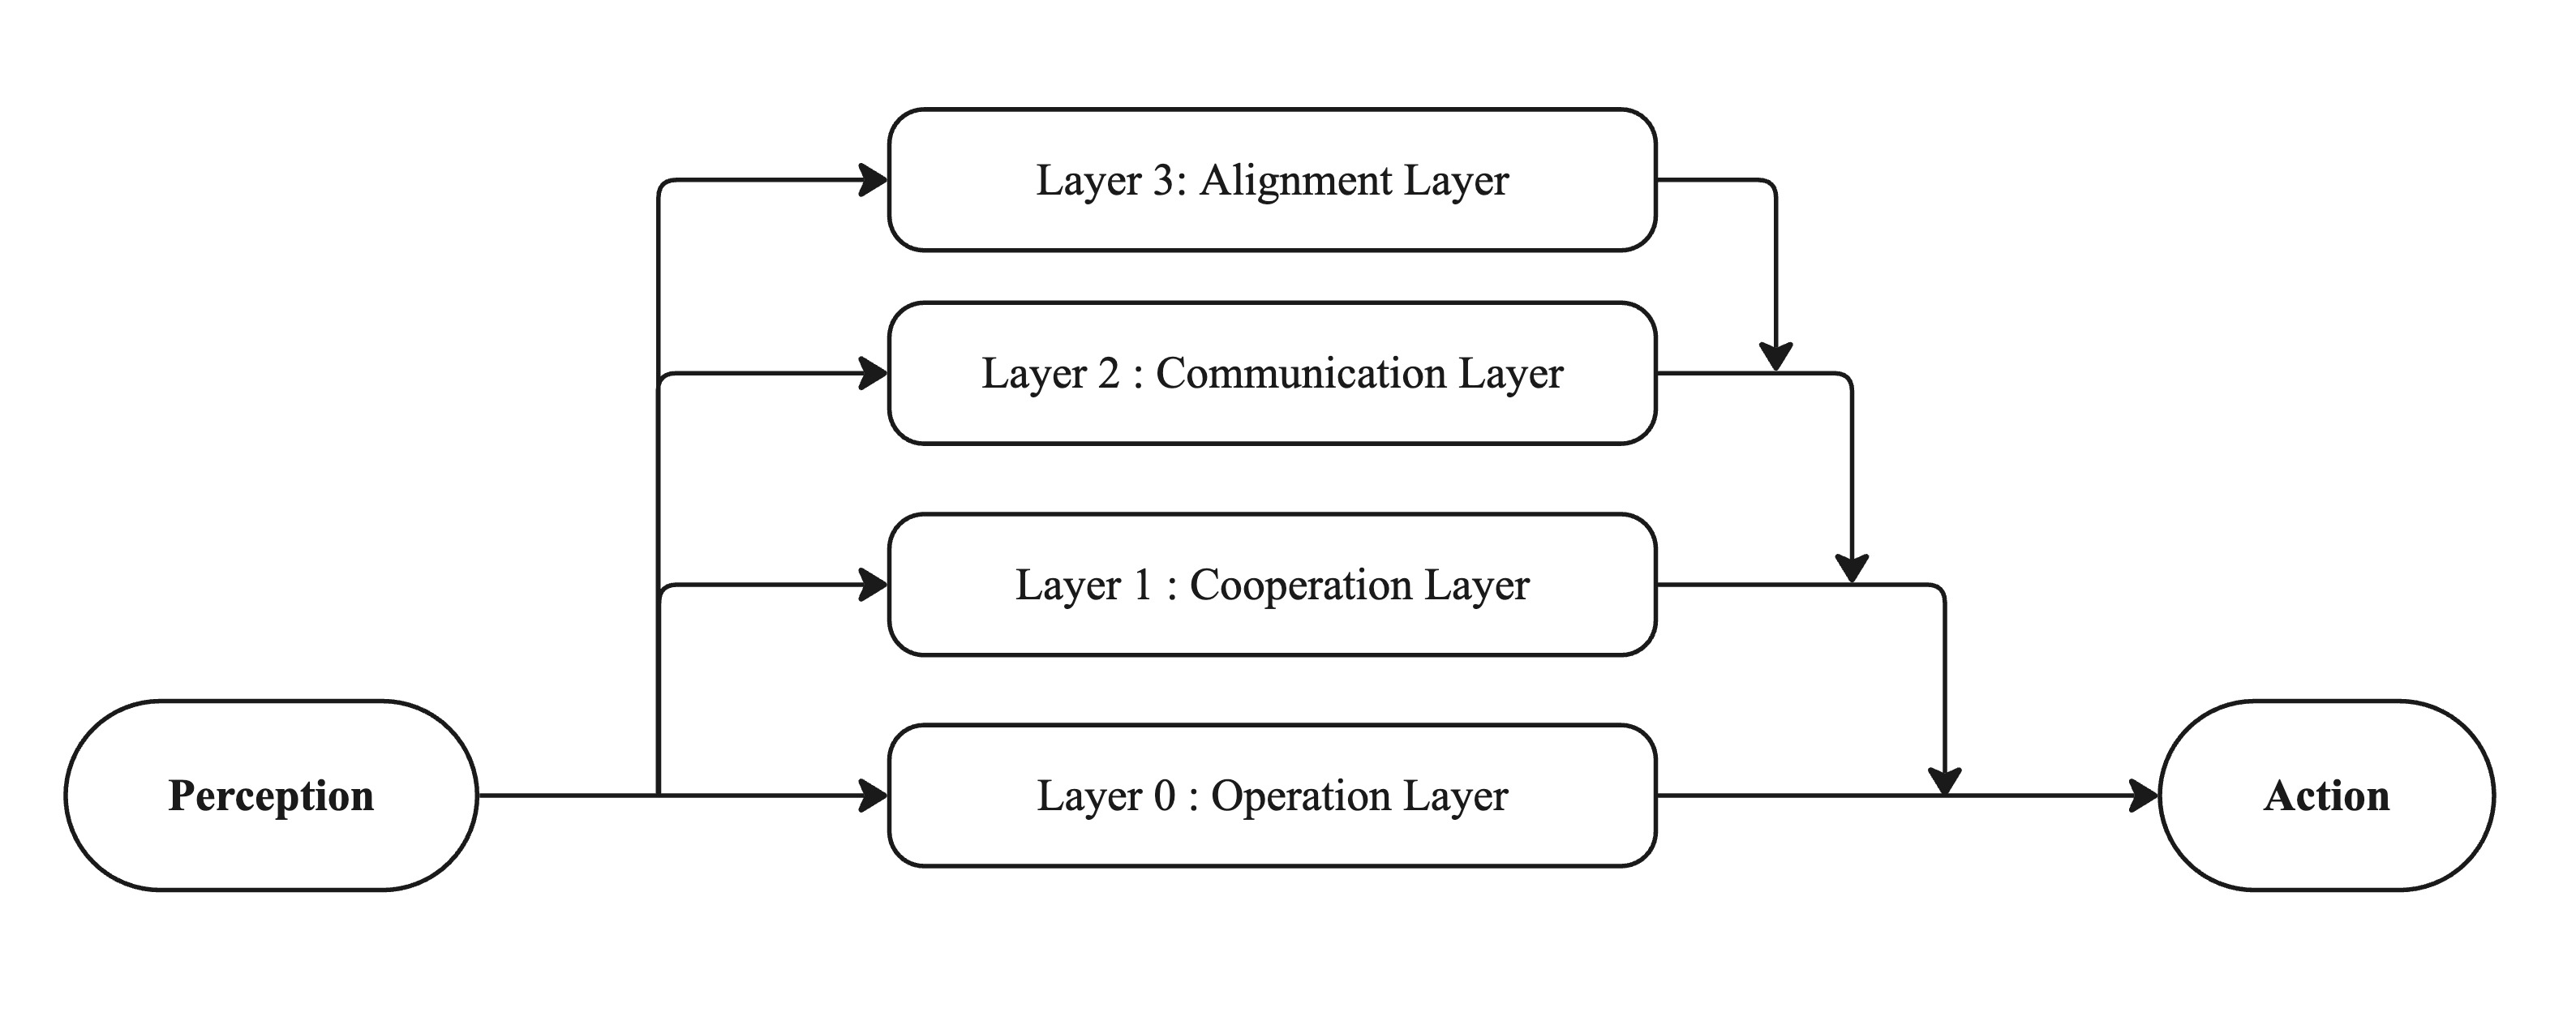
The agent is structured into four layers. The lowest layer is the operation layer, where the agent play the game on its own. Above that is the cooperation layer, where the previously solo-playing agent learns to collaborate with another agent. The communication layer follows, integrating the environment’s predefined communication protocol. Finally, at the top, the alignment layer defines three different degrees of the agent’s alignment in decision-making with human partners.
Technical Implementation
Below table shows how each layer is implemented. The original intention was to fully support a RL agent for both levels. However, ultimately, the agent was implemented by using A* path planning algorithm to ensure reliable agent performance at this level. The sequential design of the game—collect keys, unlock associated doors, gain items and chips—resulted in sparse rewards, making it difficult for RL agents to successfully learn the optimal policy.
| Layer | Level 1 | Level 2 |
|---|---|---|
| 3 | Given alignment mode – aligned, merged, diverged models | |
| 2 | Proximity‐based planning | Proximity and tile‐dependency‐based planning |
| 1 | Additional BC training with surrogate partner | Recalculate A* path every game frame |
| 0 | Behavioral Cloning model | A* path‐planning algorithm |
Path Planning — Dijkstra’s and A* Algorithm
Dijkstra’s algorithm is a graph traversal method that, given a weighted graph, finds the shortest path from a starting node to all other vertices. It operates using a greedy approach, incrementally building the optimal solution by always selecting the vertex with the currently known shortest distance from the start. The algorithm then updates the distances to neighboring vertices by adding edge costs where applicable, leaving unreachable nodes with an infinite distance value.
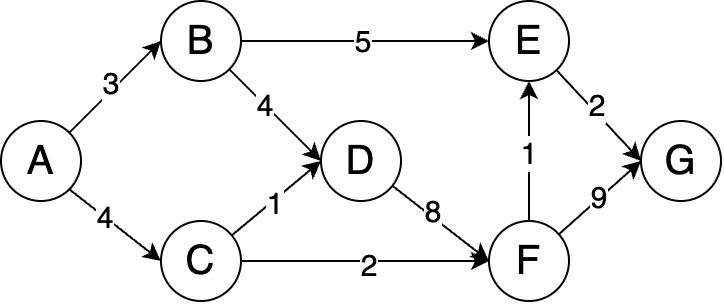
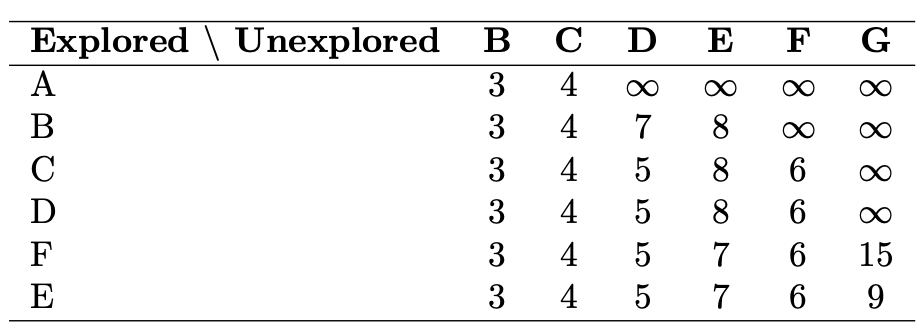
Given the example directed graph as above left, where edge weights represent the costs from one node to another, and assuming that the start node is A, the distance to the start node is initialized to 0 while all other nodes are initialized to inf (infinity).
The table above right illustrates the step-by-step process of how distances are updated using Dijkstra’s algorithm.
Building on Dijkstra’s algorithm, the A* algorithm introduces a heuristic function to optimize pathfinding by guiding the search toward the goal.
In the Co-op Tile World case, I used the A* algorithm for the agent to find the path for its next action, using the Manhattan distance from point a to point b as the heuristic function.
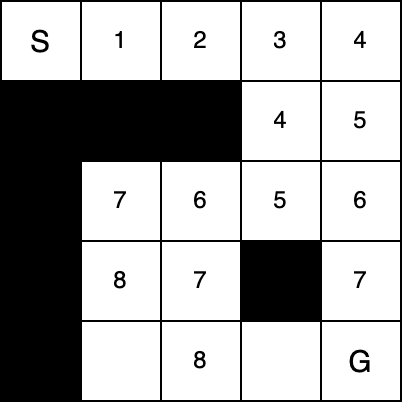
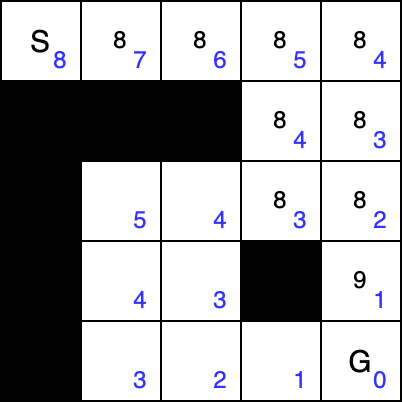
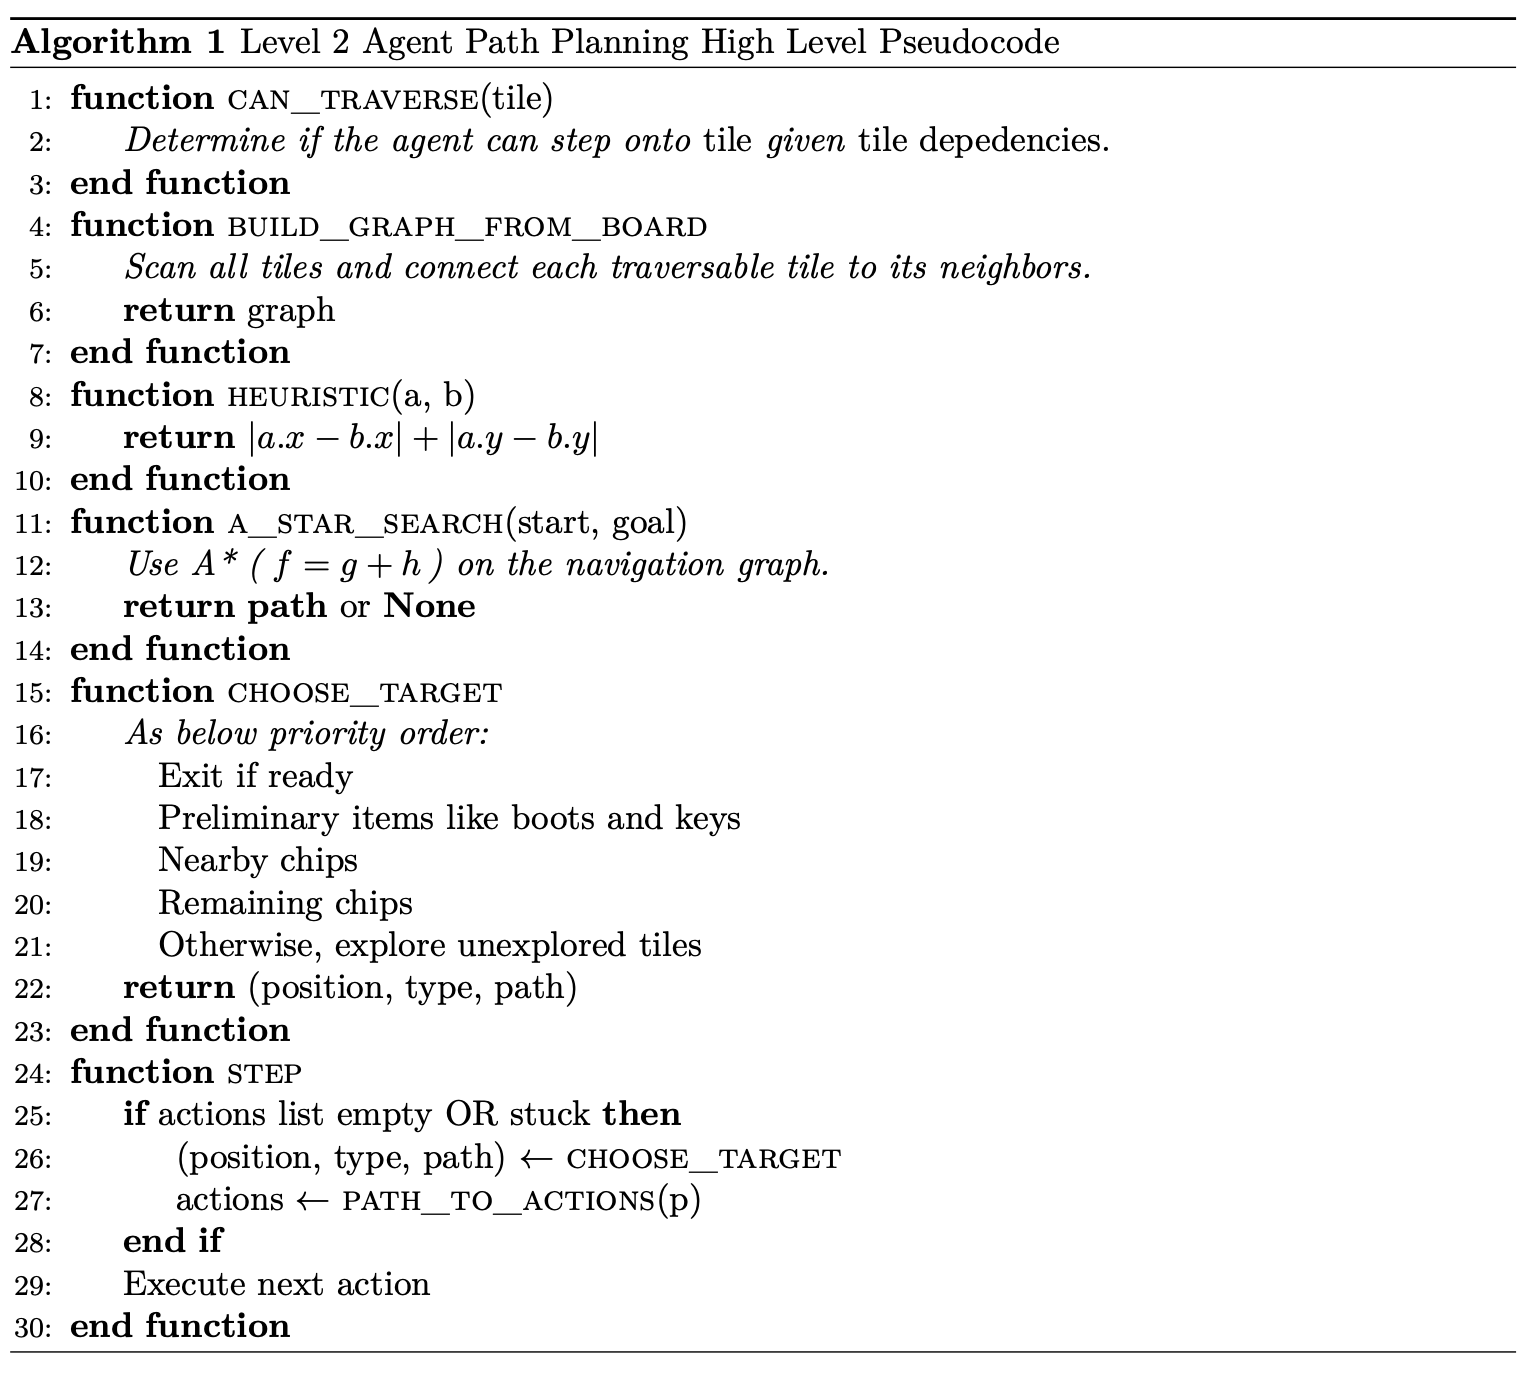
Above figure illustrates a comparison between Dijkstra’s algorithm and the A* algorithm. The blue numbers indicate the heuristic values, calculated as the Manhattan distance from each cell to the goal. The value inside each cell represents the total cost (i.e., actual cost plus heuristic, in the case of A*). Below left pseudocode shows how the A* path planning algorithm is implemented for Co-op Tworld agent.
Three modes of agnets — Aligned, Merged, and Diverged
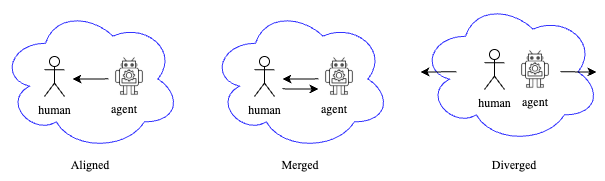
For this thesis specifically, we designed three different alignment modes in strategic decision making process.
The agent's difference in alignment mode is revealed through "tactical timeout" called by human players.
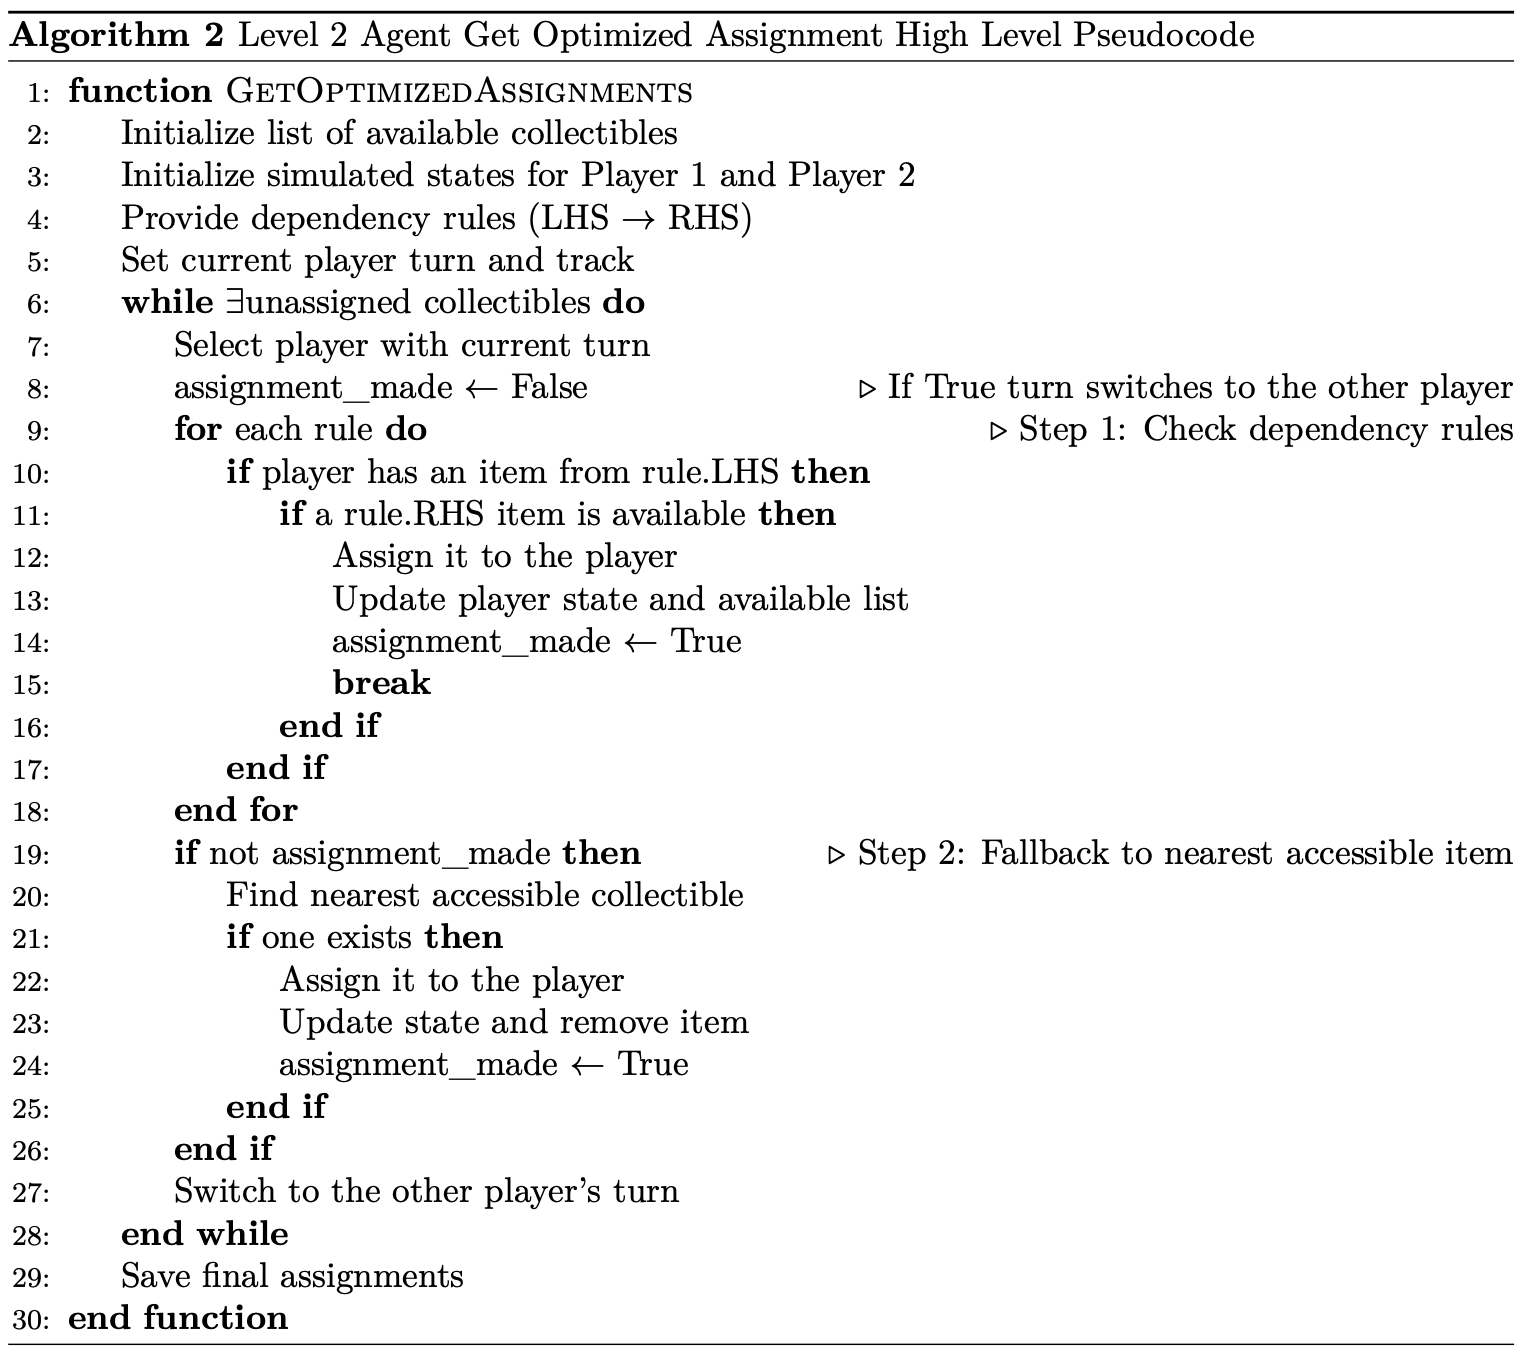
Whenever this timeout is called, the agent calls its internal get_optimized_assignments method.
This method begins by retrieving all collectible items available in the current game state.
From this list, the algorithm simulates assigning items in a turn-based manner, alternating between the two players.
Upper right pseudocode shows how the agent make decisions based on its internal planning model.
- Aligned: Player 1 suggests → Player 2 accepts → Both execute the plan together.
- Merged: Player 1 suggests → Player 2 proposes an alternative → Player 1 decides whether to accept or reject the suggestion.
- Diverged: Player 1 suggests → Player 2 rejects → No common strategy is established.
The flashlight stuns approaching moles, protecting you from them.
The player can use an overhand throw for greater precision.
An underhand throw can also be used to reach longer distances.
Assessment: Game Theory
With the custom benchmarking environment Co-op Tile World and functional agent in place, the next step was to conduct a user study using the setup to evaluate players’ cooperative performance.
Experiment Design
| Task Difficulty | Alignment Mode | ||
|---|---|---|---|
| Aligned | Merged | Diverged | |
| Easy | Easy-Aligned | Easy-Merged | Easy-Diverged |
| Difficult | Diff-Aligned | Diff-Merged | Diff-Diverged |
Based on these variants, we are using a mixed experimental design, with alignment mode as a between-subjects factor and task difficulty as a within-subjects factor.
Evaluation Criteria
| Player 2 / Player 1 | Cooperate (Stag) | Defect (Rabbit) |
|---|---|---|
| Cooperate (Rabbit) | (5, 5) | (0, 3) |
| Defect (Rabbit) | (3, 0) | (3, 3) |
| Player 1 / Player 2 | Exit | Fail to Exit |
|---|---|---|
| Exit | (M, M) | (I, 0) |
| Fail to Exit | (0, I) | (I, I) |
Note that in Table 3-B, M = Maximum team reward based on remaining time; I= Individual reward based on items collected. In this study, the primary method for assessing cooperative performance is grounded in a game-theoretic approach, which provides a structured and quantitative framework for evaluating outcomes. Specifically, we use modified Stag-Hunt game. Above table shows the original Stag-Hunt model and modified version of this thesis.
Data Collection
The full set of raw data collected through user tests can be found in figure below.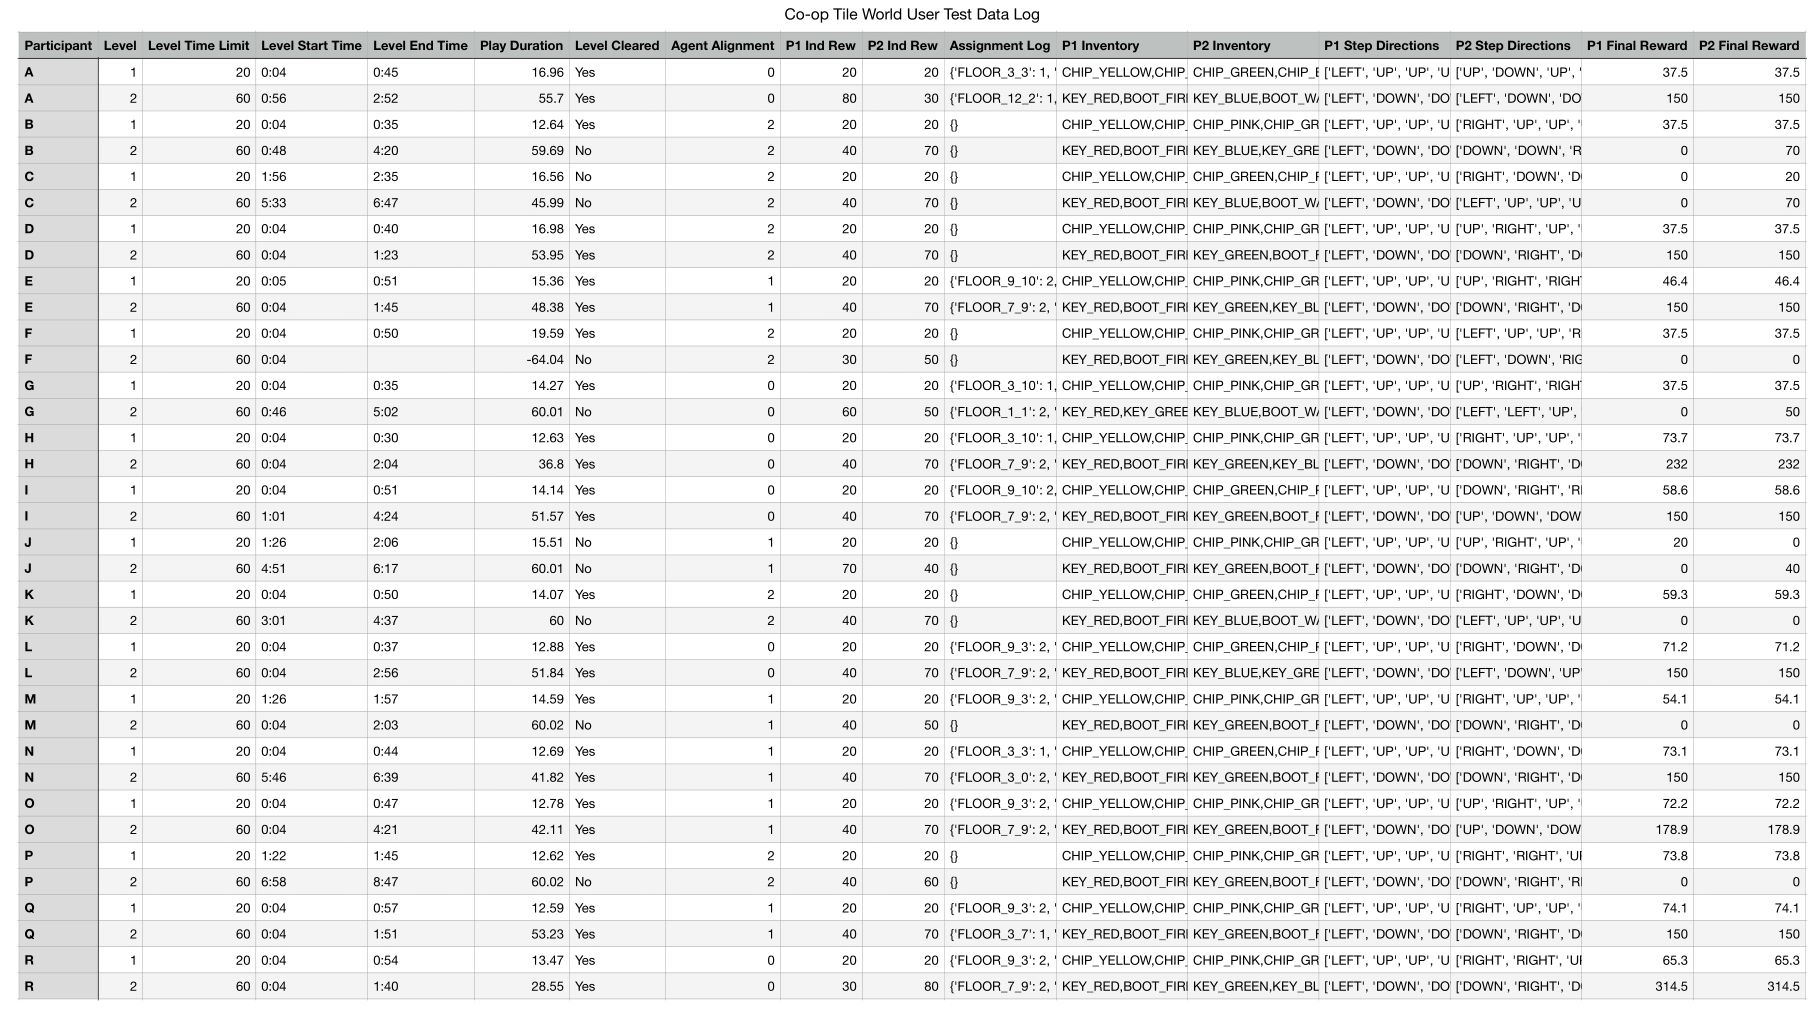
Results and Findings
Descriptive Statistics
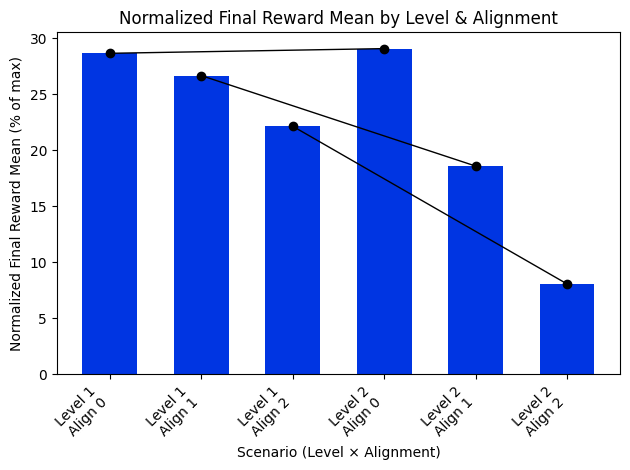
- The first bar chart pattern confirms a consistent ranking of cooperative performance: Aligned > Merged > Diverged. Furthermore, task difficulty introduces a noticeable performance decline from Level 1 to Level 2, but the magnitude of this drop differs by alignment mode.
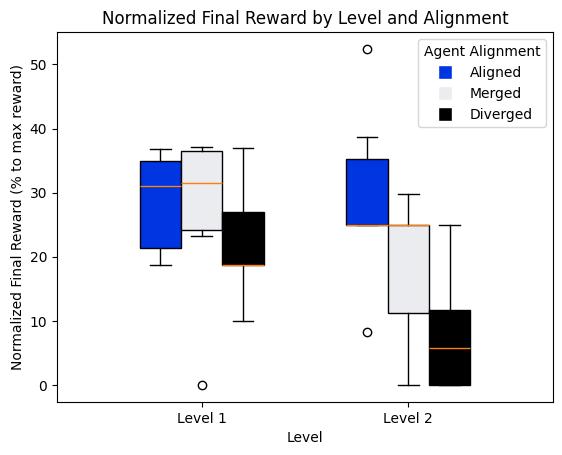
- The second box plot shows overall pattern reflects both a broader spread in participant outcomes and generally weaker cooperative performance in the diverged mode for Level 1.
- In Level 2, the distribution of aligned mode reflects a performance plateau, where many participants reached similarly high outcomes. These characteristics suggest that the aligned strategy was not only effective but also highly robust under increased task difficulty.
- Diverged mode in Level 2 exhibits a notable decline in cooperative performance.
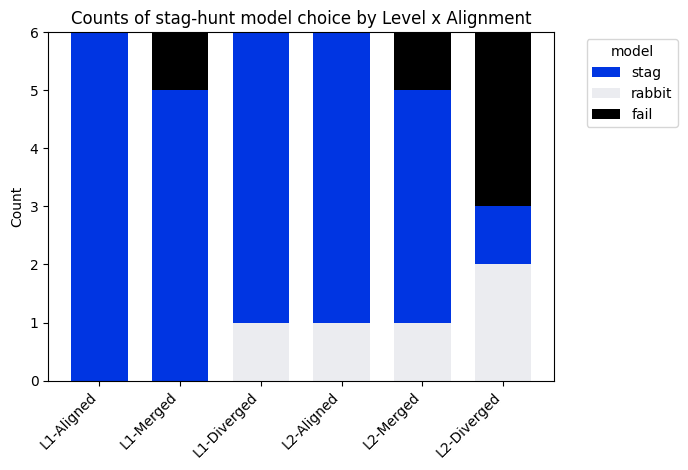
- The third fixed box plot shows Stag-Hunt strategies chosen by participants in each scenario. The pattern here underscores the difficulty of maintaining cooperative behavior with diverged agent.
Inferential Statistics
In this study, we employ a Mixed ANOVA, which compares group means across two types of factors: between-subjects factors (independent groups) and within-subjects factors (repeated measures on the same participants).
| Source | SS | df | MS | F | p | η² |
|---|---|---|---|---|---|---|
| Alignment | 1135.67 | 2 | 567.84 | 1.67 | .195 | .04 |
| Task Difficulty (Level) | 472.40 | 1 | 472.46 | 4.93 | .042 | .25 |
| Alignment × Level Interaction | 318.37 | 2 | 159.19 | 1.66 | .223 | .18 |
A mixed-design ANOVA revealed a significant main effect of task difficulty, F (1, 24) = 4.93, p= .042, partial n2 = .25, indicating a large effect size. The main effect of agent alignment was not statistically significant, F (2, 24) = 3.14, p= .073, although the effect size was large, partial n2 = .30. The interaction between alignment and level was also non-significant, F (2, 24) = 1.66, p= .223, however the effect size was large, partial n2 = .18.
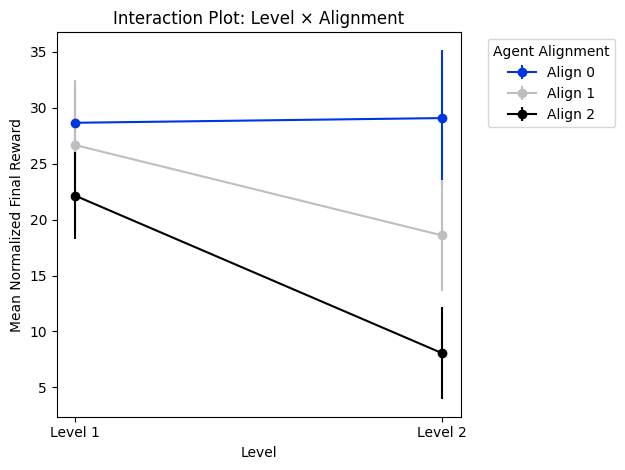
The analysis revealed no significant main effect of Alignment, p= .073. There was a significant main effect of Level, p= .042. No significant interaction was found between Level and Alignment, p= .223. Therefore, we reject the null hypothesis that task difficulty has no effect on cooperative performance, as the p-value.042 is less than the standard significance threshold of 0.05. However, we fail to reject the null hypotheses for alignment mode and the interaction effect.
Findings
- Task Difficulty and Cooperative Performance
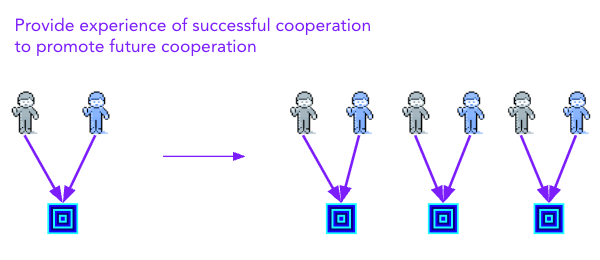
- The success or failure of a cooperative experience, and how that experience unfolds, shapes human willingness to cooperate in future cooperation.
- Experiencing low task difficulty during the initial interaction helped build successful cooperative experiences, which in turn promoted cooperation in Level 2 as well.
- Not only the success of cooperation but also the way it failed influenced future cooperation. When a failure was perceived as a lack of willingness or disregard for teamwork, humans often responded with a tit-for-tat strategy.
- Alignment Modes and Cooperative Performance
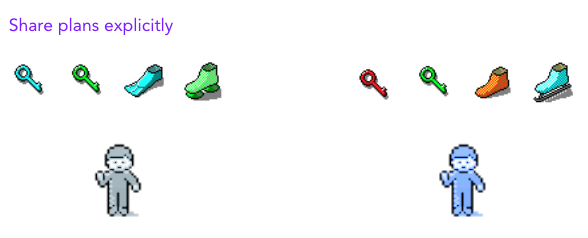
- Having a shared plan leads to improved cooperative performance.
- The agents also performed well with shared plans! — handling of uncertainty.
- Agent’s social capabilities are ultimately grounded in the reliability of its autonomous performance.
- Task Difficulty and Alignment Modes Interaction Effect
- As tasks become more complex, it becomes even more crucial to explicitly communicate shared plans.
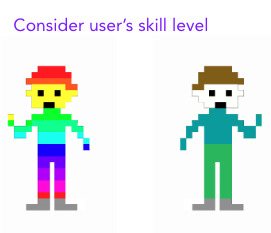
- This suggests that an agent’s alignment behavior in collective decision-making process should be dynamically adapted to the skill level of its human partner—particularly in tasks that involve high complexity.
 =
= 
Reinforcment Learning Agent
RL for Autonomous Actions
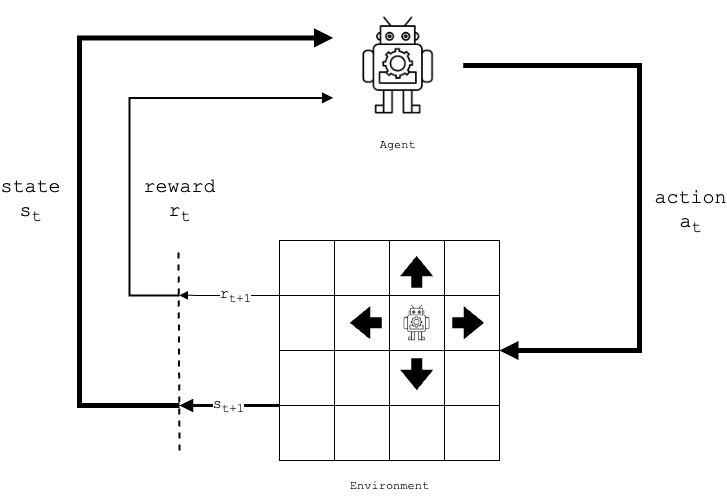
In Reinforcement Learning (RL) framework—a foundational paradigm in machine learning in which an agent learns an optimal policy to achieve a given goal. As illustrated in below figure, in classic reinforcement learning, an agent interacts with the environment by taking actions, observing the resulting state changes, and receiving associated rewards. Over time, the agent adjusts its behavior to maximize the cumulative reward based on these experiences. Central to this process is the formation of a policy—a strategy that the agent uses to decide which action to take in a given state.
RL for Cooperative Actions
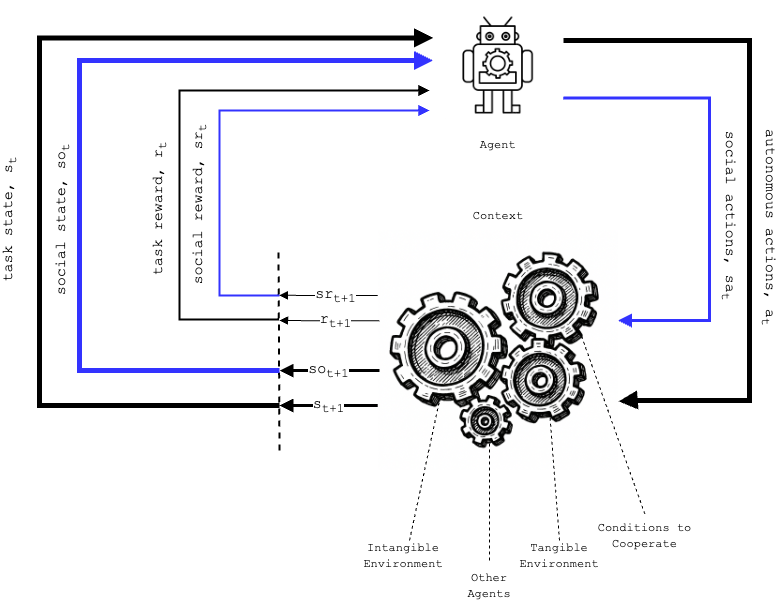
How does this framework apply to cooperative actions? Below figure demonstrates the core argument of this thesis that in cooperative scenarios, the environment must be expanded to a broader “context” that includes not only the tangible task space but also intangible environment factors such as:
- social norms
- cultural expectations
- other agents as individuals or groups
- conditions to cooperate
Cooperative Agent RL Training Experiment
Below document shows how this thesis approached to train cooperative agent using reinforcement learning framework. The sequential design of the game—collect keys, unlock associated doors, gain items and chips—resulted in sparse rewards, making it difficult for RL agents to successfully learn the optimal policy. However, this limitation indicates the next step this research should take and develop further.