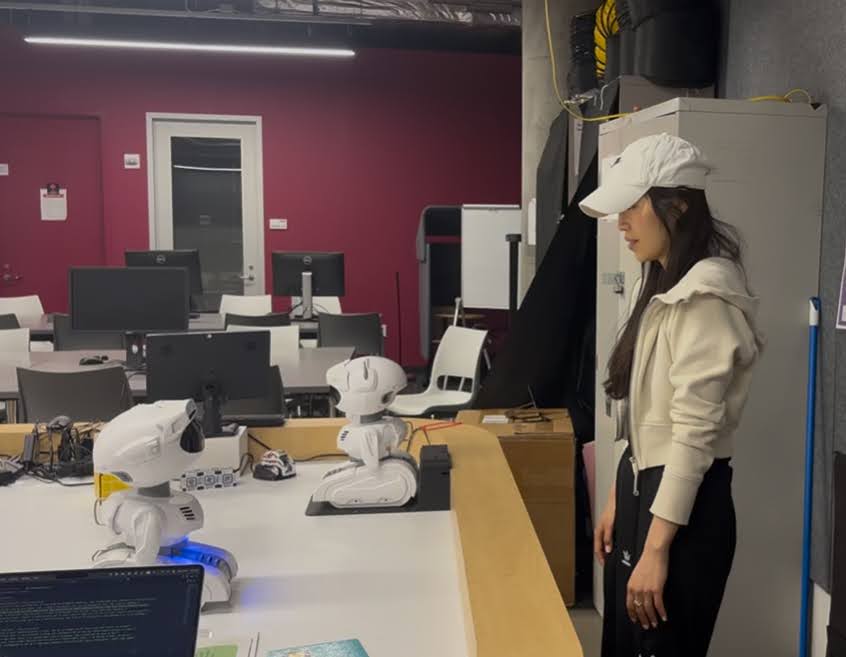
One-Two-Look Robot Misty
A sassy gaming robot
Project Overview
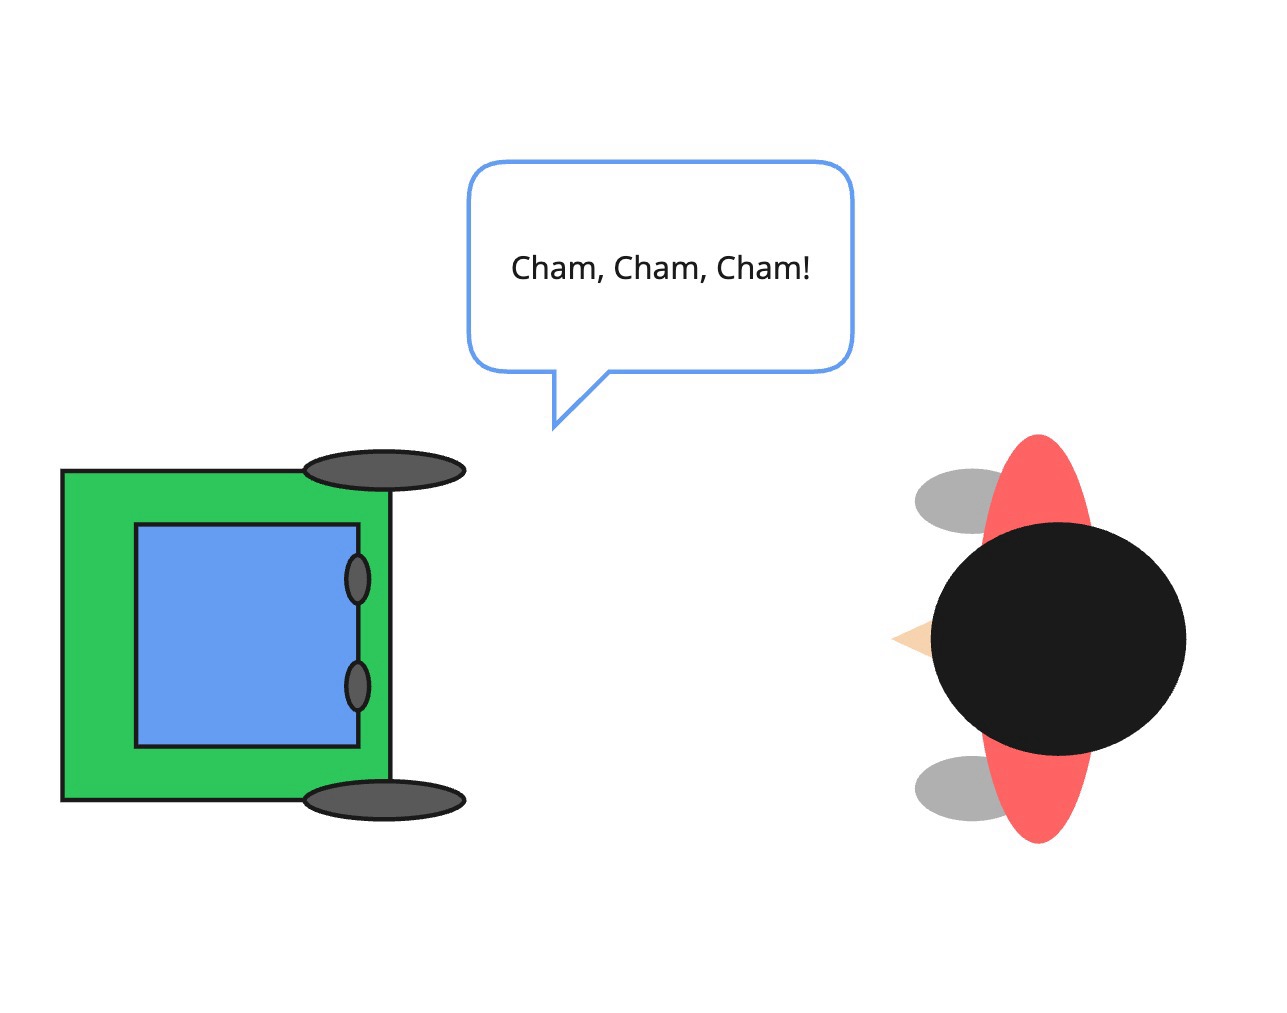
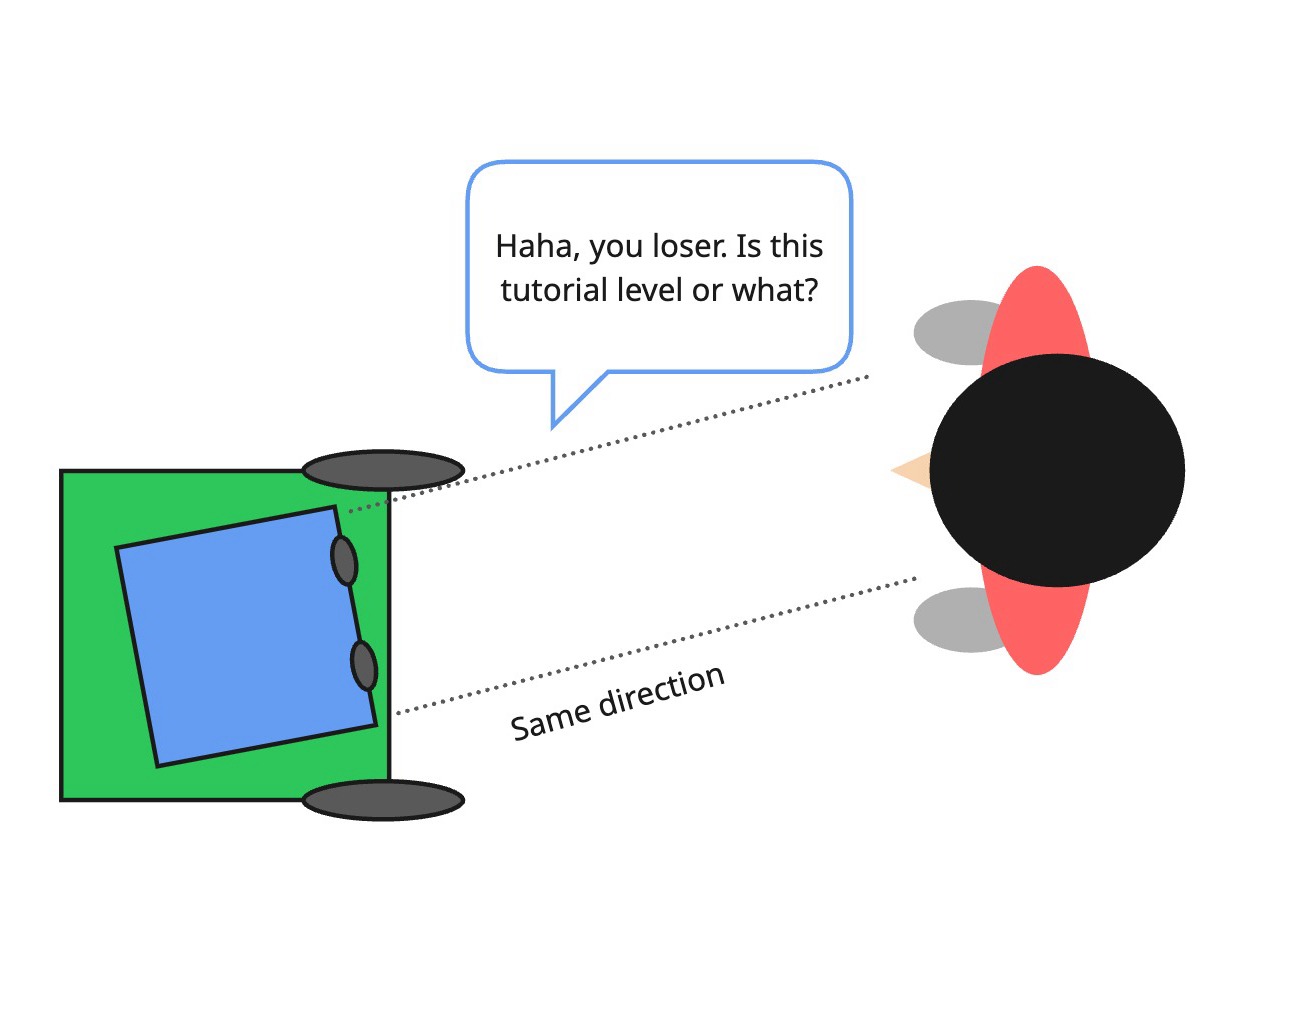
"What a Sassy robot."
In this project we build a robot that plays a simple game with you. You'll be surprised how this robot could be sassy. I want to challenge your convention that robots are such a charming, nice machines.
A Simple Rule
Game Setup
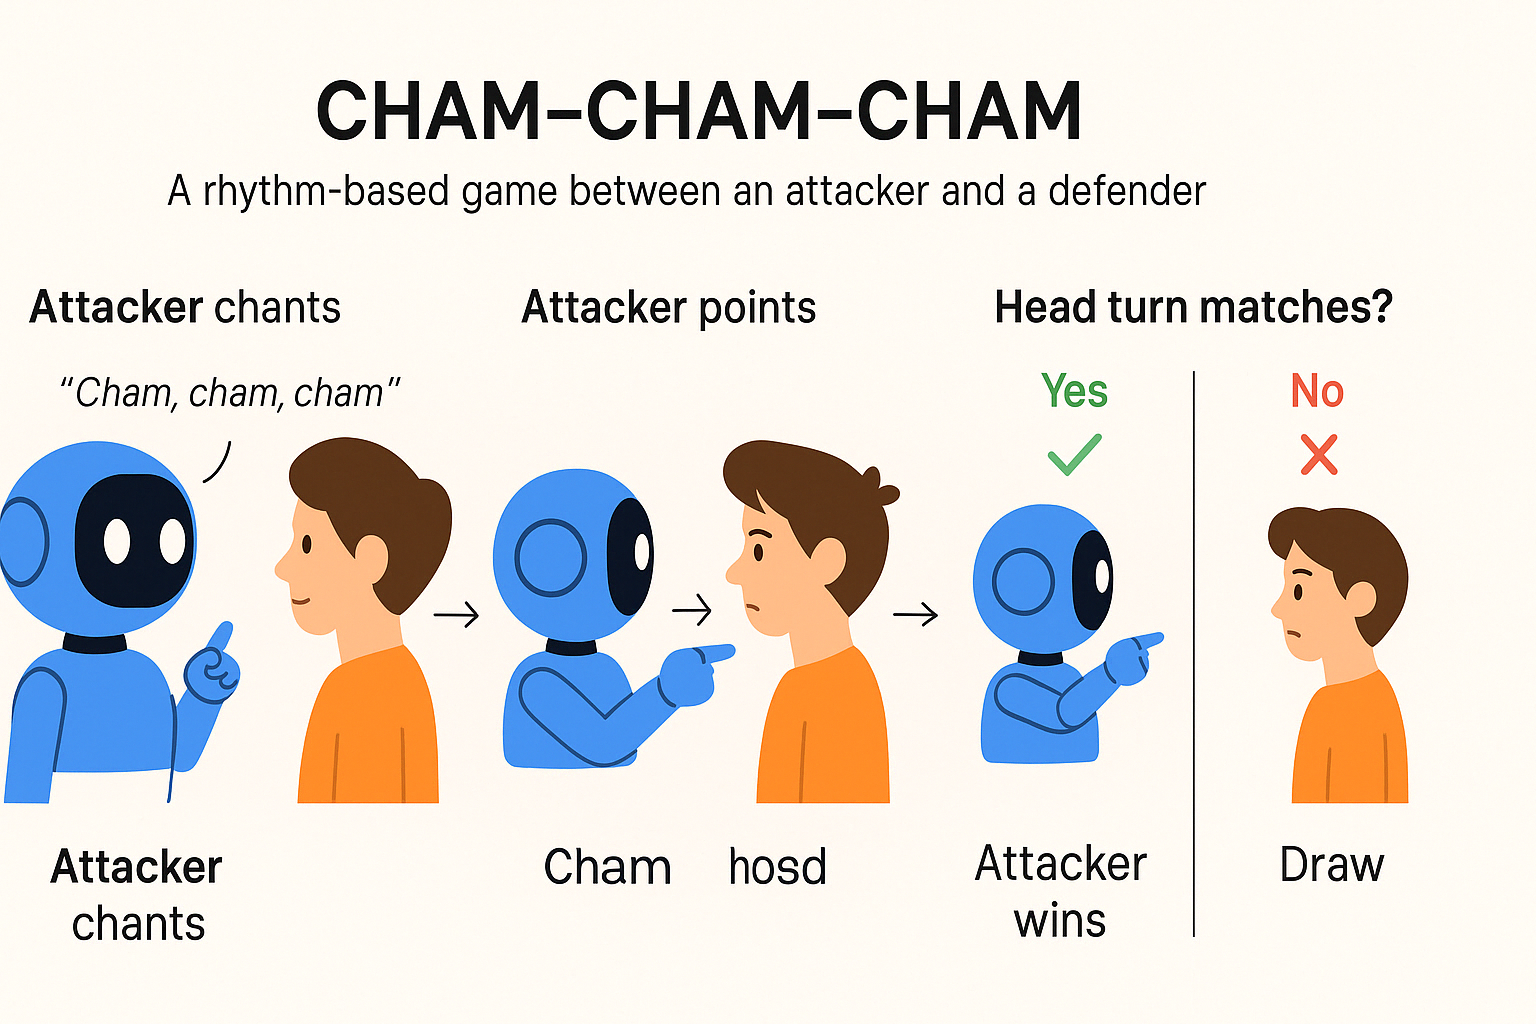
A Simple Rule
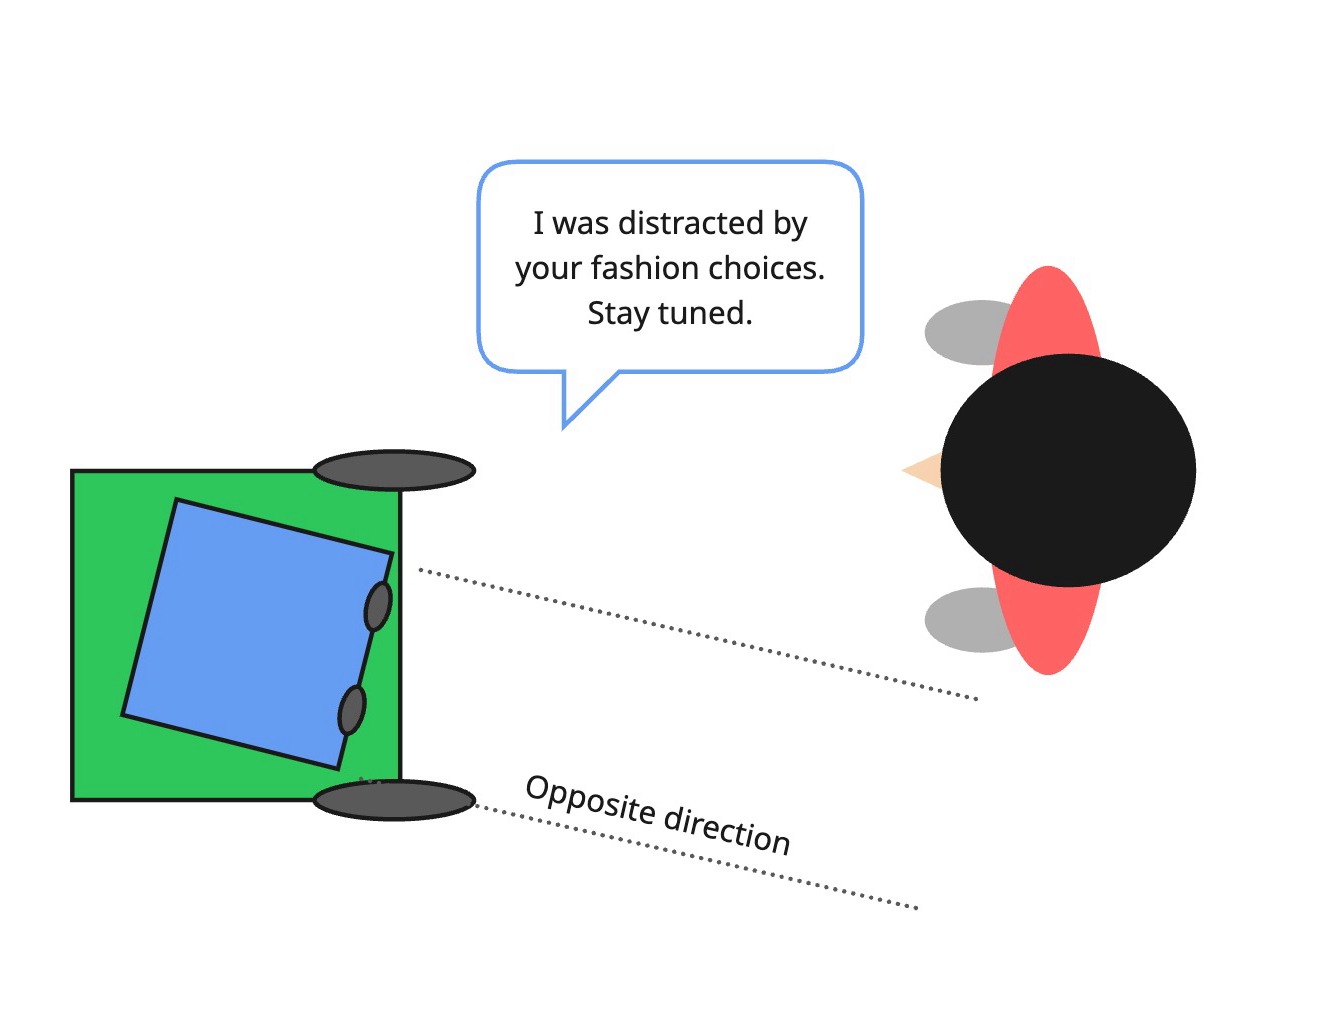
- Phase 1: After the last cham it moves it head to either left or right side.
- Phase 2-a: Opposite player loses when she moves to the same side of the robot turned its head.
- Phase 2-b: Opposite player wins when she moves to the opposite side of the robot turned its head.
What We Tested: Descriptive Statistics
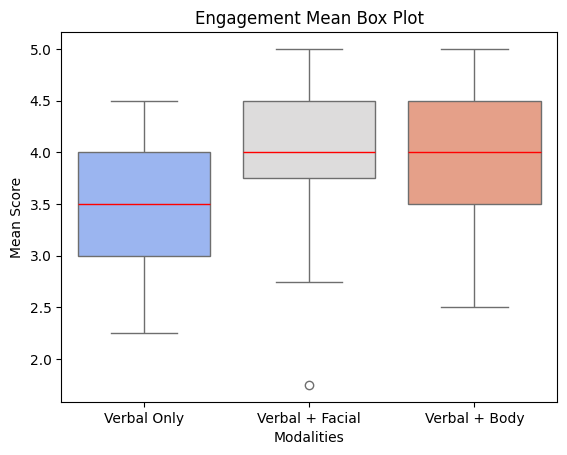
We tested which non verbal communication features—facial expressions or body movements—most effectively enhances user engagement in human-robot interaction scenarios and anthropomorphic perception of robots.
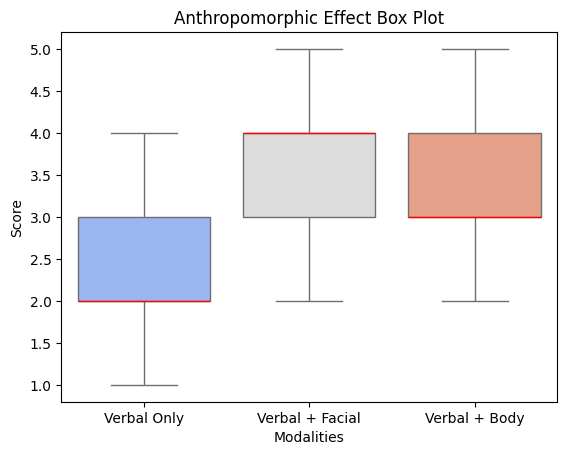
Box Plots of Two Variables
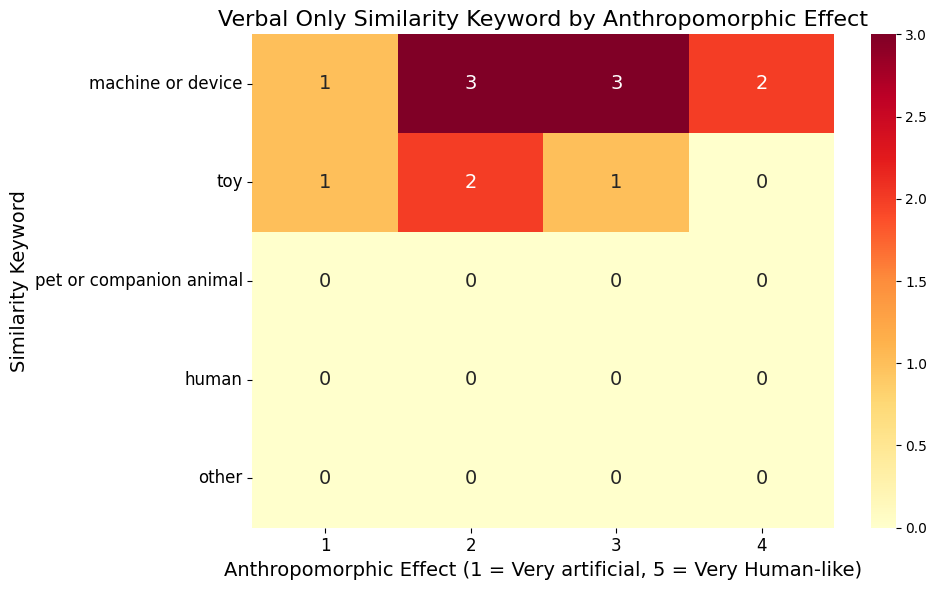
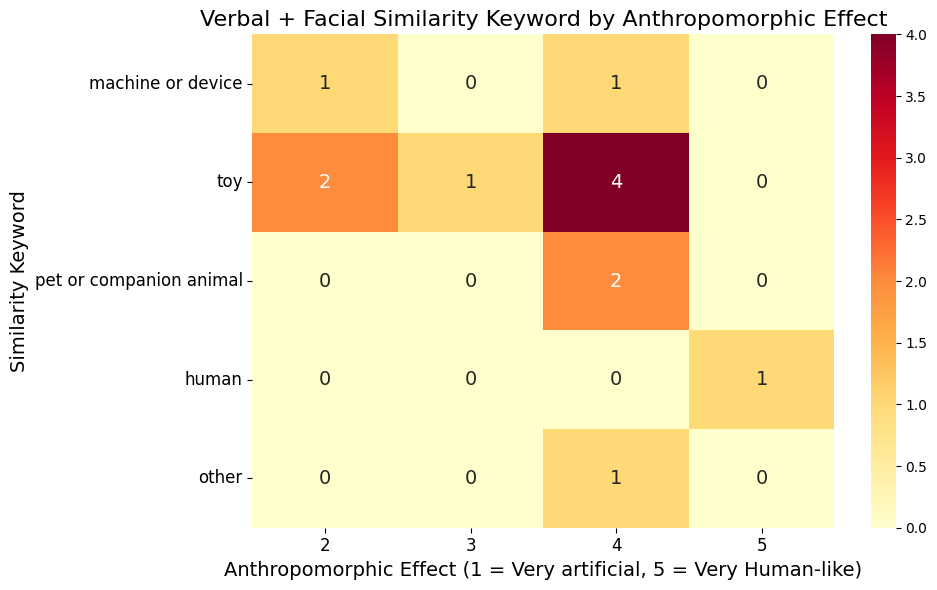
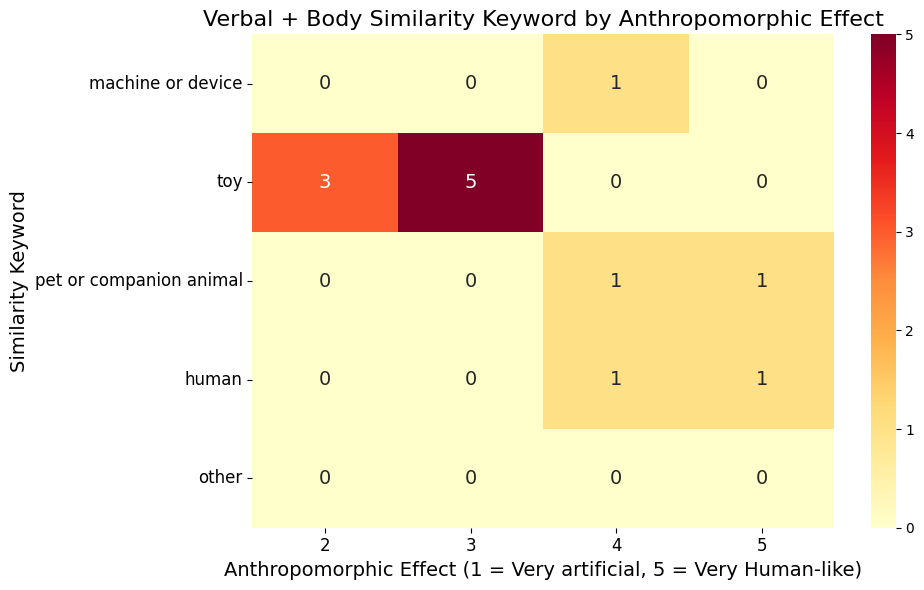
Anthropomorphic Effect (AE) to Similarity Keyword Heat Map
What We Concluded: Inferential Statistics
Utilizing the sample data, we perform inferential statistics. The process of validating the independent variables effect on dependent variable was as below:
- Perform repeated Analysis of Variance (ANOVA) to find there are significant differences in group means at least two of the groups.
- Perform pairwise t-tests to examine which conditions differ from each other. Here we compare the control group to two experimental groups.
- Perform correlation analysis to see if there is any correlation between dependent variables – engagement and anthropomorphic effect.
Repeated ANOVA
Repeated ANOVA is a type of hypothetical test that tries to verify the effect of the independent variable by rejecting the null hypothesis with predefined significance value p.
Engagement:
A one-way repeated measures ANOVA was conducted to examine the effect of modality on engagement. The result revealed a non-significant main effect of modality on the engagement, F(2, 24) = 2.93, p = .073, partial η² = .085.
| Source | SS | df | MS | F | p | η2 |
|---|---|---|---|---|---|---|
| Modality | 2.93 | 2 | 1.01 | 2.93 | .073 | .085 |
| Error | 8.24 | 24 | 0.34 |
A one-way repeated measures ANOVA was conducted to examine the effect of modality on anthropomorphic effect. The result revealed a significant main effect of modality on anthropomorphic effect, F(2, 24) = 2.93, p = .001512, partial η² = .192.
| Source | SS | df | MS | F | p | η2 |
|---|---|---|---|---|---|---|
| Modality | 8.36 | 2 | 4.18 | 8.62 | .002 | .192 |
| Error | 11.6 | 24 | 0.49 |
Post hoc analysis; Pairwise t-tests
Paired t-test is a method used to test whether the mean difference exists between pairs of measurements. We ran pairwise t-tests using open-source python statistical package pingouin. To correct p-values against the risk of false positives, we used one-step Bonferroni correction.
| Pairs | t(12) | p-corr | Hedges’ g | BF10 |
|---|---|---|---|---|
| Verbal vs Facial | 4.07 | .005 | 1.08 | 27.26 |
| Verbal vs Body | 3.39 | .016 | 0.82 | 9.72 |
A paired-samples t-test revealed a significant difference between verbal only and verbal + facial expression, t(12) = 4.07, p = .005, g = 1.08.
Verbal + Body Movement:
A paired-samples t-test revealed a significant difference between verbal only and verbal + body movement, t(12) = 3.39, p = .016, g = 0.82.
Correlation
Lastly, we checked the correlation between reported engagement mean and anthropomorphic effect using Pearson r correlation. Pearson correlation coefficient (r) is a way of measuring a linear correlation. The value ranges (-1, 1), measures the strength and negative, positive, or none relation between two variables. We conducted Pearson r test using stats module from scipy package.
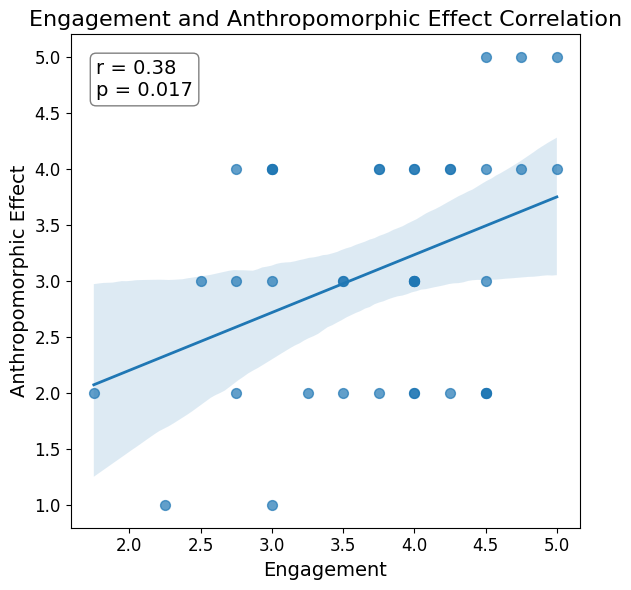
There was a significant positive correlation between participant’s reported engagement level and their perceived anthropomorphic effect, r(37) = 0.38, p = 0.017.